Software development tools are much more sophisticated than they used to be. Nowhere is that more true than in the tools used for developing signal processing software. Ten years ago, most engineers choosing a processor for a signal processing application paid scant attention to the quality of the development tools. They were far more interested in processor architecture and key performance metrics like speed, energy consumption, and cost. As long as there was an assembler, linker, debugger, and simulator, that was good enough. Back then, some DSPs did not even have compilers—which was fine, since most engineers expected to work in assembly language anyway.
Times have changed. Today’s signal processing software developers expect—and require—much more help from their tools. The best tools have sophisticated, specialized features tuned specifically for developing signal processing software. Developers are increasingly relying on these features to help them write and optimize their signal processing software more efficiently. As a result, engineers today consider software development tools to be as important—or even more important—than processor architecture.
Complicated Apps and Architectures
Two key changes have caused software development tools to become critical. First, signal processing applications have become much bigger and more complex, making it impractical to write full applications in assembly language. Thus, good compilers and other high-level language tools have become essential.
Second, the processor architectures used in signal processing applications have become much more complicated. Today’s processors often execute multiple instructions per cycle. They have deep pipelines and multi-cycle instruction latencies; complex, multi-level memory architectures that may include dynamic caches; and a range of co-processors and smart peripherals. These processors are much more challenging software targets than the comparatively simple DSPs of a decade ago.
The increasing complexity of processor architectures is significant for signal processing software developers, who tend to work “closer to the metal” than other programmers. Signal processing applications generally have to be highly optimized to meet demanding speed, cost, and energy constraints. As a result, programmers must become intimately familiar with the processor’s architecture in order to develop tight, well-optimized code. The more complicated the architecture, the more complicated the programming and optimization effort. Good tools can make the difference between meeting key application constraints in a timely way and not.
How Applications are Developed
When a new signal processing application is developed, the programmer typically starts off by working in C. (For a discussion of C and other languages used in signal processing software development, see “Languages for Signal Processing Software Development.”)
Then the programmer evaluates the performance of the compiled code, which will almost certainly not be good enough to meet the constraints of the application. At this point the programmer may spend some time on C-level optimizations, trying to help the compiler do a better job. Or she might jump directly into assembly code. In either case, the programmer uses an iterative process of refining the code (whether in C or assembly), debugging it, and profiling it to identify bottlenecks.
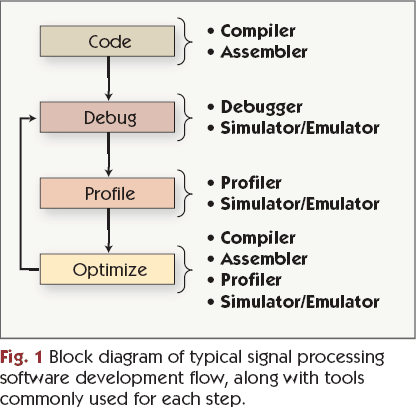
The typical flow of signal processing software development is shown in Figure 1 along with the tools commonly used in each step.

Where Tools Come From
Most DSP processor vendors develop their tools in-house, and there are several advantages to this approach. No-one knows a processor’s architecture better than its vendor. Therefore, the vendor is typically best equipped to create an efficient compiler. Also, the processor vendor usually knows the needs of its customers and can tailor its tools to support specific target applications.
But there are also downsides to home-grown tools. Not all processor vendors have the resources or know-how to create a top-notch tool suite, and users may have to learn a completely new set of tools if they switch processor vendors.
In contrast to DSP processor vendors, most general-purpose processor vendors use outside companies to provide their tool suites. The processor vendor may provide the back-end for the compiler, but almost everything else—including the IDE—is created by the outside company. One of the largest independent tool providers is Green Hills Software, which provides tools for a wide range of general-purpose processors, as well as for several DSPs. From the user’s perspective, an advantage to this approach is that the tool provider is (presumably) very experienced in developing tools that are user-friendly, stable, and efficient. A further benefit is that the user interface is common among many processors. But the tool developer may not have designed the tools to meet the special needs of signal processing software developers.
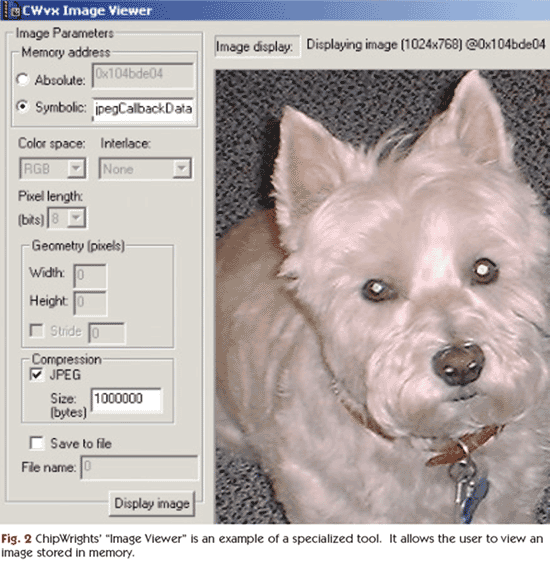
Some companies try to achieve the best of both worlds. ChipWrights, for example, is a company that sells chips intended for use in image processing products like digital cameras. Its tool suite was mostly developed by Metrowerks, but the suite also includes a home-grown tool called an “Image Viewer” that allows the user to view an image stored in memory. (See Figure 2.) This sort of feature is not common in software tools; it was developed specifically with the needs of ChipWrights’ customers in mind.

Coding: Compilers and Other Tools
Many of today’s C compilers are pretty good at handling signal processing software, though there is a huge range in efficiency. Many are able to implement some of the optimization tricks that were once the exclusive domain of assembly programmers, such as software pipelining.
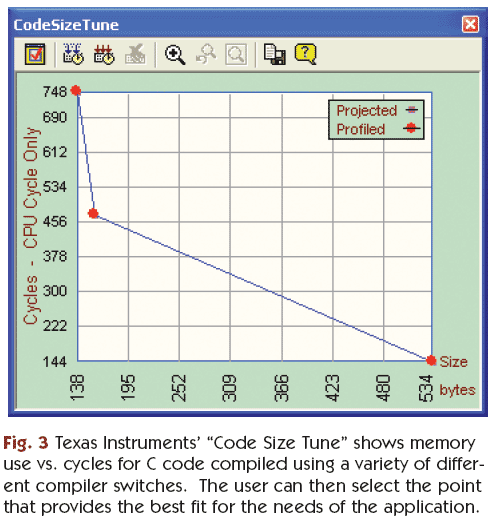
For much signal processing software, optimizations that improve speed come at the cost of additional memory use. As a result, the programmer or compiler typically must decide how to trade off speed versus memory use. Some optimizations also have the undesirable side effect of making the software more difficult to read and debug, thus adding another trade-off. Most compilers allow the programmer to set a compiler switch that governs how aggressively they want the code to be optimized. Taking this one step further, Texas Instruments offers a tool called “Code Size Tune” that builds and profiles the C code using a variety of compiler switches, then displays the resulting memory use versus speed trade-off in a graph. The user can then choose the point on the graph that best fits the needs of the application. (See Figure 3.)

Many general-purpose processors use SIMD (single-instruction, multiple data) operations to improve their performance on signal processing algorithms. Intel’s Pentium III and Pentium 4 processors, for example, make heavy use of SIMD in their MMX and SSE extensions. Although SIMD is effective for speeding up signal processing code, it is difficult for compilers to use SIMD features well. Some compilers do not even try to do so, instead leaving it to the programmer to use assembly code for the inner loops where SIMD tends to be most useful. One of the ways in which Intel helps its customers utilize its processors’ SIMD capabilities is by providing a library of optimized signal processing functions (the IPP Library) that can be called from the C code. For more on IPP and other libraries, see “Software Building Blocks for Signal Processing Applications.”
Intel also offers a tool called “Tuning Assistant” (part of the company’s “Vtune” package) which, among other features, provides the programmer with suggestions on where to use hand-coded SIMD instructions—and examples of how to do so.
Because engineers often need to tweak their assembly code to squeeze out the best possible performance, most processor vendors targeting signal processing applications offer strong support for assembly language programming. But a few vendors (like Equator, for example) don’t. Instead, they encourage the engineer to rely on “intrinsics.” Intrinsics are meta-instructions that are embedded within C code and get translated by the compiler into a predefined sequence of assembly instructions. Using intrinsics gives the programmer a way to access assembly language without actually having to code in assembly and can help keep software portable between processors. In practice, however, intrinsics are not always good enough. They only support a specific set of functions that may or may not be a good fit for what the programmer is trying to do. If they are not a good fit, and the processor vendor does not support assembly coding, the programmer is out of luck: There is no way to access the assembly code to improve its performance or efficiency. For signal processing applications, where highly optimized software is crucial for competitive products, this limitation can be frustrating.
Debugging: Does it Work Yet?
Once the software is written, the programmer must debug it and make sure it works as expected. This is typically accomplished using a software simulator, an emulator, or a hardware development board. In any case, the programmer will need a way to feed in data, run the software, and observe the output. Signal processing applications tend to require large amounts of data streaming in and out of the processor, so it is helpful if the tools have an easy way to deal with I/O. For large data sets, running the software on a development board may be the easiest way to test it. Some development boards come equipped with specialized I/O ports tailored for applications such as audio or video processing. These ports can ease testing of these applications. Other boards have very limited I/O capabilities. Some vendor’s tools provide connectivity to higher-level tools, like MATLAB, which can be used for custom analysis and visualization of output data.
Because of the real-time nature of most signal processing applications, debugging is often easier if the programmer can check program variables while the software is running—without stopping the processor. Analog Devices provides a feature called “Background Telemetry Channel” with some of its emulators. The Background Telemetry Channel provides a shared group of registers that enable the host processor and target processor to exchange data without stopping the target processor or affecting its real-time performance. In a similar vein, some processors allow the programmer to specify complex combinations of breakpoint conditions, while others are limited to very simple breakpoint capabilities.
To quickly determine the cycle-by-cycle behavior of the code (which can be important both for debugging and optimization), it is critical to have a cycle-accurate simulator. Ideally it should be one that accurately models things like cache effects, memory conflicts, peripherals, and I/O. It is particularly helpful if the simulator maintains cycle-accuracy even during single-stepping. Green Hills recently introduced an extension to its tool suite, called “TimeMachine,” that allows the programmer to step and run through code both forwards and backwards. This feature is useful for debugging since it allows the programmer to step backwards after an error has been detected in order to investigate the cause of the error.
Although programmers often want a highly accurate processor simulator, it is often the case that the more accurate the simulator, the slower it is. For this reason, some vendors offer several different simulators geared towards testing different aspects of the code—a functional simulator that is fast but not cycle-accurate; a cycle-accurate simulator; and possibly a separate cache simulator. In addition, some third-party tool vendors offer fast, cycle-accurate processor models for a range of processors.
Many chips include several processors and/or coprocessors. Developing software written for these chips and verifying the interaction between processors can be extremely challenging. This challenge can be eased with tools specifically designed for multiprocessor software development. For example, Cradle Technologies, a company that makes multiprocessor chips, offers a debugger called “Inspector” that provides a single graphical interface that lets the programmer step, run, and use breakpoints on multiple processors at the same time.
Some signal processing algorithms, like FFTs and filters, produce data that is most easily analyzed graphically. With such algorithms, it is often easier to understand a software bug when the data is presented in a graphical format than as a series of numbers. Common formats for data visualization include FFT waterfalls, eye diagrams, and constellation diagrams. Being able to display the contents of registers and memory locations in multiple formats that are relevant to signal processing applications is also helpful. For example, DSP processor tools typically support fixed-point formats—like Q15—as well as decimal integer and hexadecimal.
Profiling and Optimization: Focus on the Hot Spots
Most signal processing applications require well-optimized code. To quickly home in on where the optimization effort will be most fruitful, the programmer needs to be able to identify the “hot spots” in the code where the processor is spending the majority of its time.
Back when processors were pretty simple, with single-issue architectures and (mostly) single-cycle latencies, programmers could determine by inspection how many cycles each section of their code consumed. Code optimization consisted primarily of using specialized instructions, eliminating pipeline stalls, and making sure that key sections of code and data were kept in on-chip memory. With the advent of more complicated architectures, though, it can be nearly impossible to determine manually how many cycles a given section of code will take to execute. Programmers increasingly have to rely on profiling tools, software simulators, and on-chip performance counters to help them understand the cycle-by-cycle performance of their code and locate the hot spots. A number of vendors offer profiling tools that show, either graphically or in a table, where the bulk of the cycles are consumed.
Once the programmer has gathered the profiling information, she can potentially use this information to optimize the code at a number of different levels. For example, the code can be optimized at the algorithm level (by choosing a different algorithm, or perhaps re-ordering the processing steps), at the C level, or at the assembly level. Optimization is typically an iterative process, with the programmer making changes to the code, debugging it, and then re-profiling it to determine where the new hot spots are. Good profiling tools can make a big difference in how easy this process will be.


Add new comment